Not all years of the same model are equal. We compare failure rates across every production year to tell you whether the car you're looking at is from a good run - or whether a different year would be a materially better buy.
Why the same model varies by year
Manufacturers quietly change things during a model's production run. Sometimes it's an improvement - a recurring issue gets fixed, a component gets upgraded, a recall gets addressed. Sometimes it goes the other way.
Manufacturers often address known problems without announcing it. The 2018 version of a model may have a fix the 2016 version never received.
A supplier switch or design revision can make a meaningful difference to long-term reliability - for better or worse.
A mid-cycle refresh sometimes introduces new issues alongside cosmetic improvements. The data often reveals this before reviewers do.
Early production runs of a new model can have higher defect rates. Later years often benefit from improved manufacturing consistency.
What it looks like in your report
App screengrab
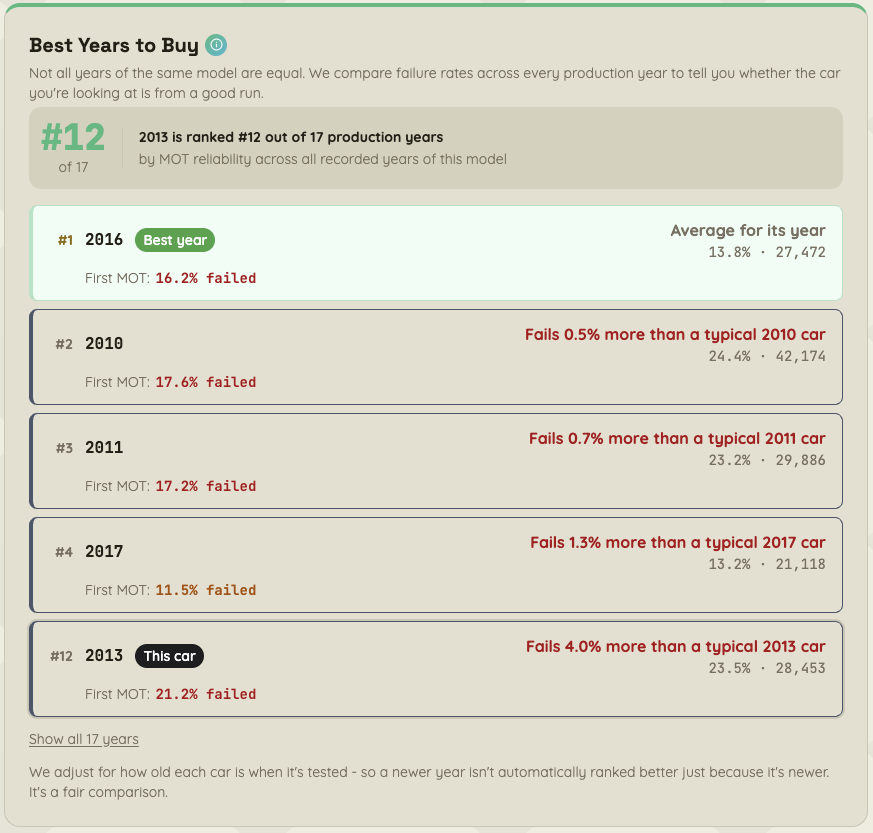
Reliability scores by production year - showing which years outperform the average and which to approach with caution.
How to use this in your search
If the car you're looking at is from a weaker year, you have three options:
Find the best year for any model
One of 13 intelligence sections in every BIB report. £3 per car.
Open BIB