Find the right year.
Not just the right model.
One year of a model can fail its annual safety test at 12%. Another year of the exact same model: 34%. Explorer searches 143 million MOT tests to show you which years to look for - and which to avoid - before you start.
The same badge doesn't mean the same car.
A 2017 Ford Focus and a 2015 Ford Focus look identical in a listing. But they can have very different track records. One year of a model might fail its annual safety test 11% of the time. Another year, 34%. Same name on the badge. Very different odds of a repair bill.
Most buyers don't know this. They search by model name and then pick the cheapest one they can find - without realising some years are considerably more reliable than others. Explorer gives you the intelligence to choose the right year first, so you start your search already knowing what to look for.
Illustrative example - actual figures vary by model
Three steps to knowing what to search for
Type the model you have in mind. Explorer covers every make and model sold and tested in the UK - from city cars to large SUVs, motorcycles to pickups.
One credit unlocks the complete intelligence profile for that model. Re-view it as many times as you like at no extra cost. Every model you've previously researched is saved for quick access.
Explorer shows every production year ranked by how often it fails its annual safety test - with the best years highlighted in green, the worst in red, and a full breakdown of what to look out for in person.
Nine things in every Explorer report
One Bib unlocks the full intelligence profile. Here's everything that's inside.
Search any UK make and model. Explorer covers every make, model, and production year tested on UK roads - from city cars to large SUVs, motorcycles to pickups.
Two comparable alternatives from the same class, benchmarked side by side so you know what else to consider before committing to a search.
The top 3 production years ranked by lowest failure rate, highlighted in green. These are the years worth focusing your search on.
The worst-performing years highlighted in red. Some years of the same model fail at nearly three times the rate of the best - same badge, very different odds.
Every production year shown visually, ranked by how often it fails its annual safety test. At a glance, you can see which years hold up and which don't.
A 0-100 score showing where this model sits nationally, compared to similar cars in the same class. Above 80 is excellent. Below 40 is worth thinking carefully about.
How this model performed at its very first MOT - before any owner's maintenance could affect the result. A signal of how well it was built, not how well it was looked after.
The most common MOT failure areas for this model, grouped by type - Brakes, Suspension, Body and Structure, and more. Know exactly what to look at before you go.
Where the data supports it, reliability figures are shown separately by fuel type. A diesel version can behave very differently from the petrol - and the numbers show it.
What you see when you open Explorer
Everything in one screen. Here's what each part does.
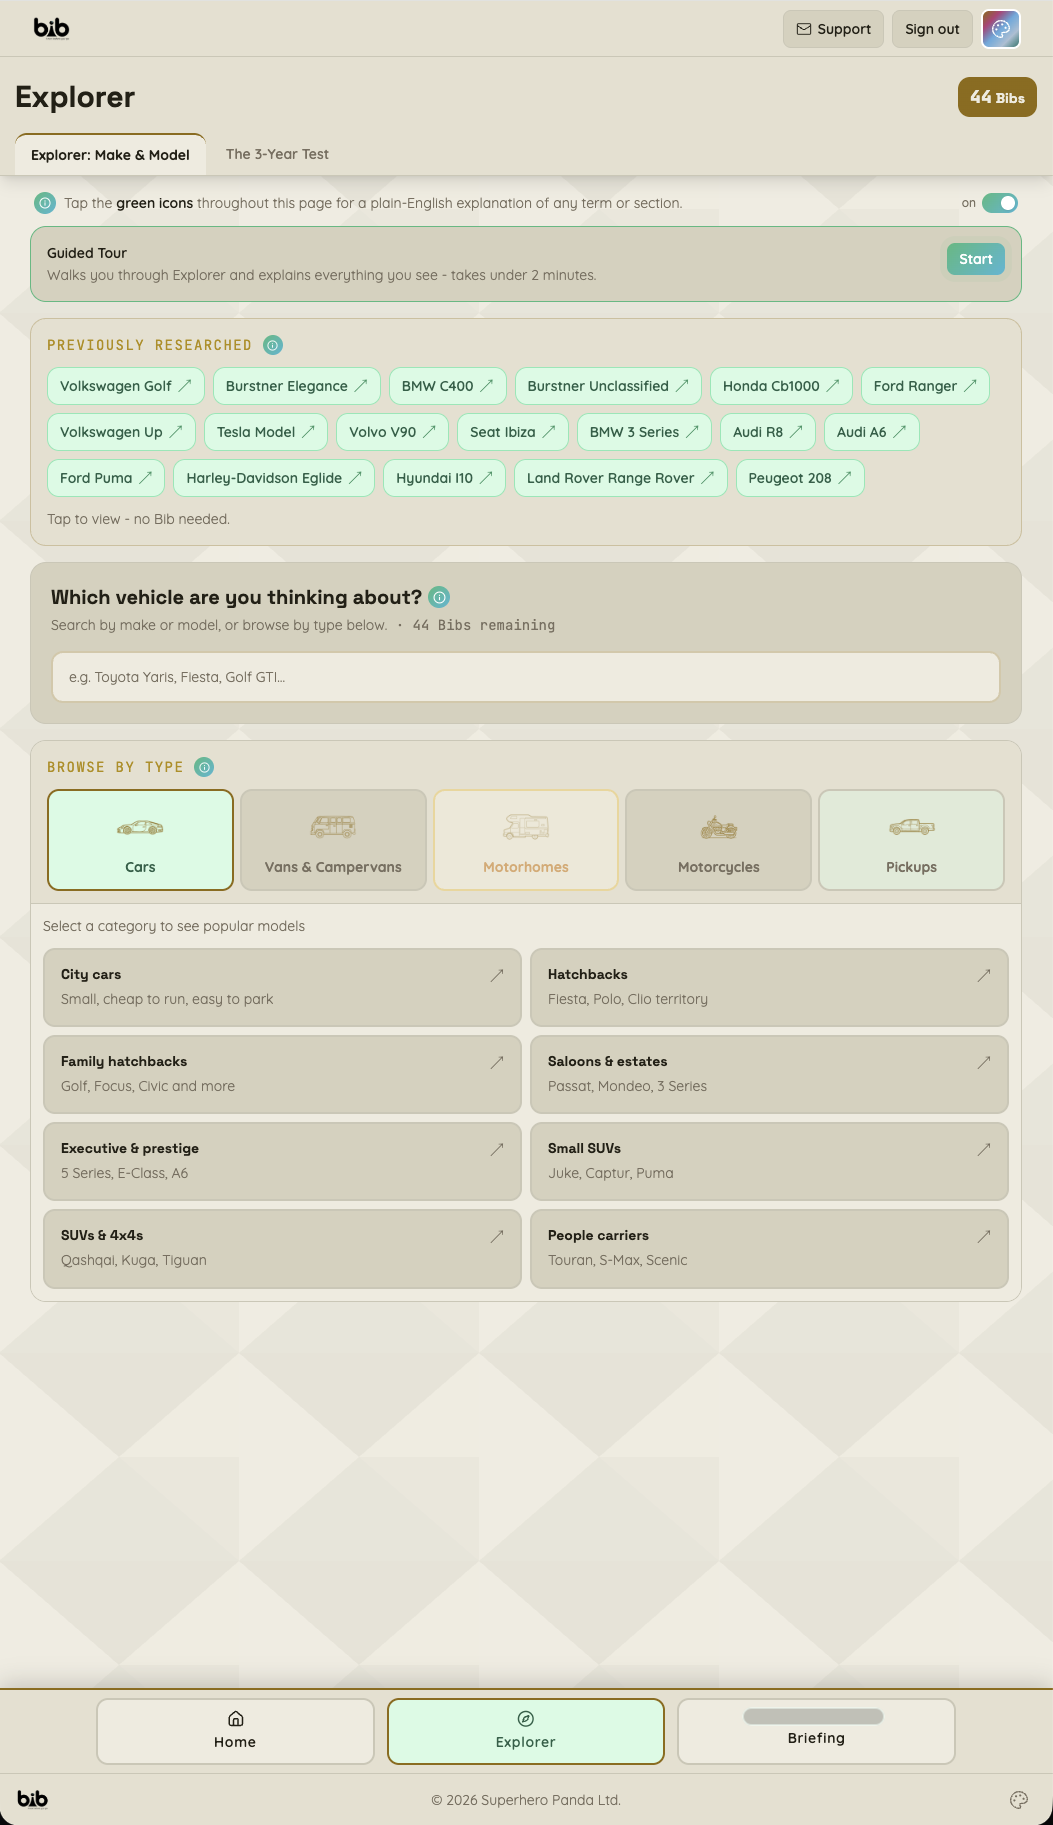
What each part does
Select a number to see a screenshot and explanation of that section.
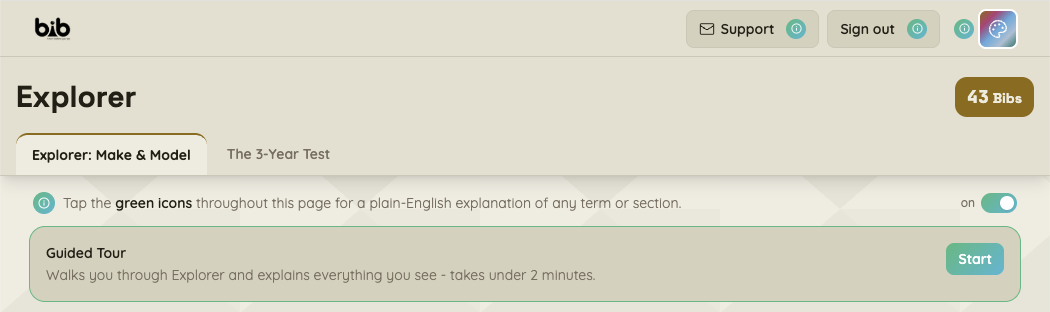
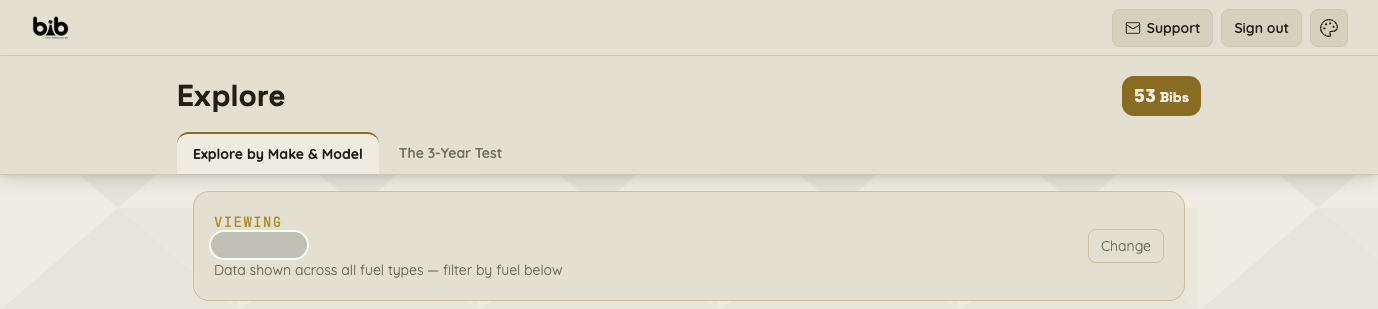
Switch between Home, Explorer, and the 3-Year Test at any time. The top tabs keep your full research toolkit a single tap apart.
Inside an Explorer report
Scroll the phone or tap a numbered dot to explore.
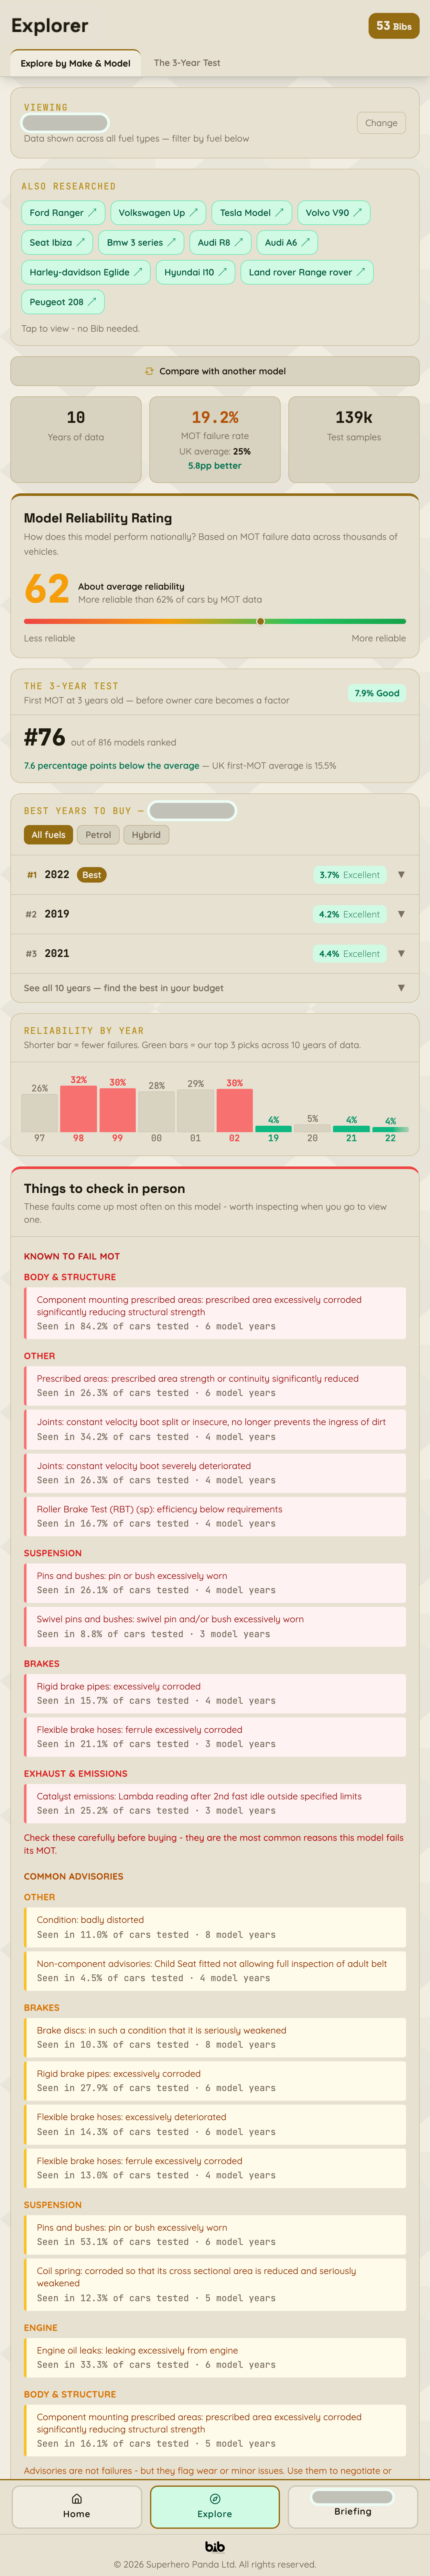
Scroll to explore · tap a number to jump
Inside an Explorer report
Scroll the phone on the left, or click a section below to jump straight to it.
Model Overview
Type any UK make and model. Explorer covers every make, model, and production year tested on UK roads - from city cars to large SUVs, motorcycles to pickups. Fuel type filters appear automatically where the data supports a separate profile.
Where the numbers come from
Every figure in Explorer comes from the UK government's official MOT records - the same ones that capture every pass, fail, and advisory from every test centre in the country.
What "MOT failure rate" means in plain English: the percentage of cars of that model and year that fail their annual safety test. The UK average is roughly one in four (25%). A model at 12% is failing at half the national rate. One at 40% is failing at nearly twice it.
Every UK market segment
From city cars to pickups, motorcycles to luxury SUVs - if it's tested on UK roads, Explorer covers it.
Researched a few models? Now compare them.
No extra BibsOnce you've researched two or more models in Explorer, a "Compare with another model" button appears in each intelligence view. Select up to three and see their reliability scores, average failure rates, best years, and common issues side by side - all in a single scrollable view.
Learn about Model ComparisonExplorer or Briefing?
They answer different questions. Most buyers use both - Explorer to decide what to search for, Briefing to check the specific car they find.
Still deciding what to search for
You have a model in mind but haven't found a specific car yet.
Ready to check a specific car
You have a registration plate and want to know if that car is worth viewing.
Know what to search for before you start searching.
One Bib unlocks the full intelligence profile for any UK make and model. Find the right year first.