Three cars.
One view. Real data.
When you've narrowed your search to two or three candidates, Model Comparison puts their reliability records side by side - drawn from millions of real UK MOT tests. No opinions. No star ratings invented by a reviewer. Just what actually happens when these cars go for their MOT.
It grows out of where you're already working
Comparison is not a separate section of the app. It appears naturally in two places once you've done your research.
When you've researched a model
When you're looking at a model's intelligence in Explorer, a "Compare with another model" button appears. Tapping it opens a selector showing the models you've already researched. Pick one or two more and the comparison opens.
When you're reading a saved car's Briefing
When you're reading the Briefing for one of your saved cars, a "Compare" button appears alongside the Garage button. Tapping it opens the same selector, this time showing the other cars from your garage.
Four taps to a side-by-side view
Start where you already are - no separate entry point needed.
The Compare button appears in the Explorer intelligence view and next to the Garage button in any saved Briefing.
The selector shows models you've already researched - no searching required. The current car is always included as the starting point.
The button shows how many models you've selected ("View comparison - 2 models"). Tap it and the comparison loads.
Each car gets its own column
A colour runs all the way down each column so it's always clear which number belongs to which car. Up to three cars, side by side.
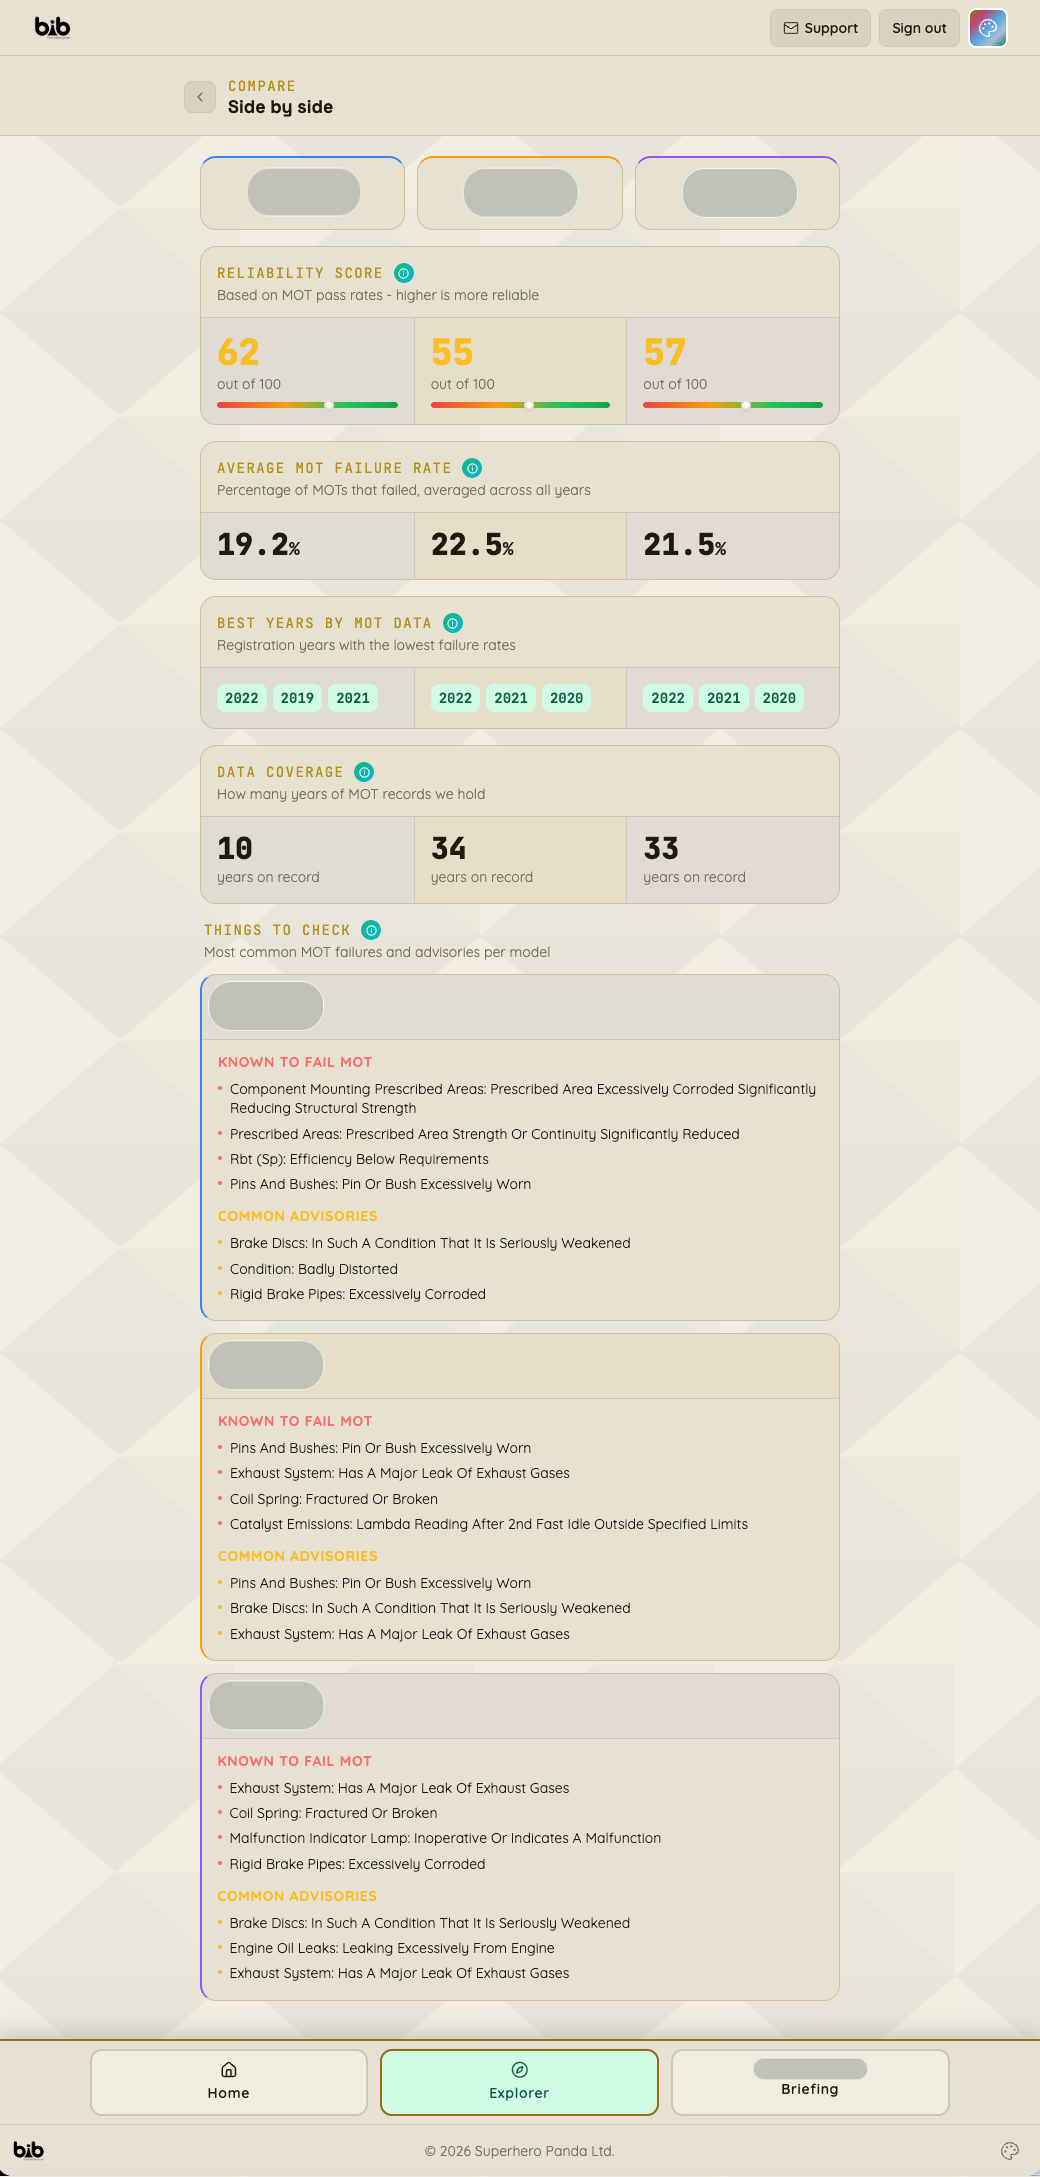
The complete comparison in one scrollable view - vehicle header, reliability scores, failure rates, best years, data coverage, and Things to Check
Select up to three cars you've already researched
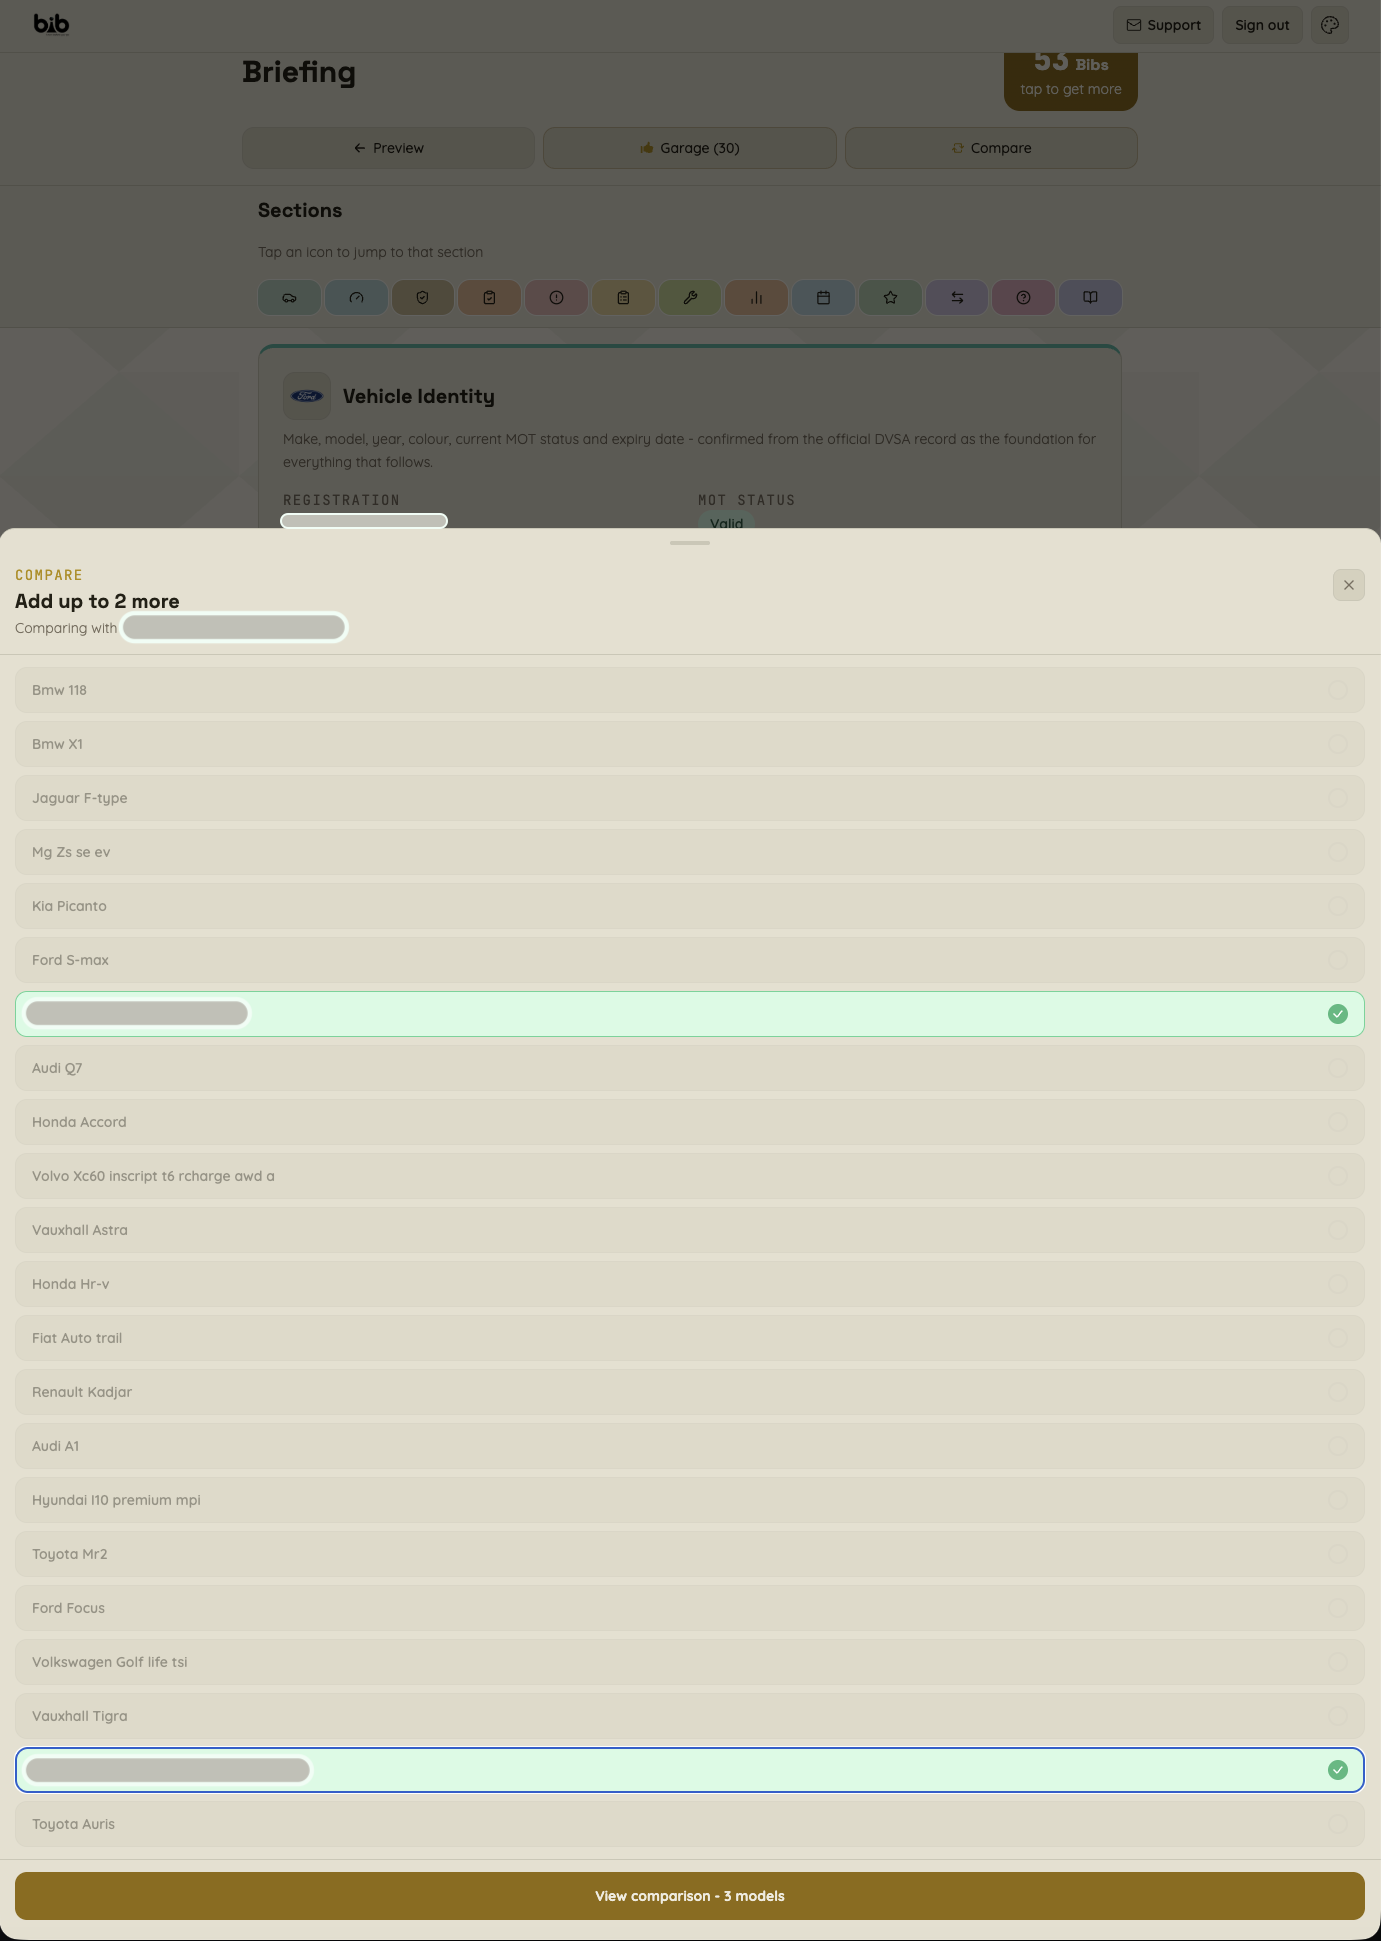
When you tap Compare, this pop-up appears inviting you to select up to three vehicles to compare side by side. Only vehicles you have already searched and saved will appear in the list.
Five data areas, across all cars at once
The same data that powers every BIB Briefing and Explorer result - presented side by side so differences are immediately readable.
A 0-100 number derived from MOT pass rates. Higher is better. Shown with a gradient bar so you can see at a glance where each car sits.
The percentage of MOTs that resulted in a failure, averaged across all years on record. A raw number with no editorial spin.
The registration years with the lowest failure rates, shown as green pills. Useful if you have flexibility on year of manufacture.
How many years of MOT records BIB holds for that model. Gives context on how much the numbers are based on - thin data is visible.
The most recurring MOT failures and advisories for each model, stacked by car. Real items flagged in real MOT tests - know what to look for at a physical inspection.
BIB doesn't name a winner
All three cars are presented with equal weight. The data is the decision-maker, not the app. This is deliberate - BIB's position is to give people the information and let them decide. That's what makes it trustworthy.
If a model has thinner data - fewer years on record - that's visible. The user can see it and factor it in. No hiding.
Comparing costs nothing extra
The data was already unlocked when you researched each model. Model Comparison is a view of data you've already paid for, presented differently. You can compare any combination of models you've previously researched without spending another Bib.
The moment before you commit
You've narrowed your search to two or three realistic candidates and want a fact-based way to choose. You've done your research. You're not browsing. This is the moment before you commit to viewing a car or making an offer.
You already own a car in your garage and are thinking about your next one. Compare the reliability profile of what you know against something new - with the same data you'd use for any purchase decision.
Research two or three models. Then compare them for free.
Start in Explorer. Research the models you're considering. The comparison is waiting when you're ready.