Nine mechanical categories. 289 million MOT records. A clear picture of what this car's components are likely to need - before you even walk through the door.
What the Wear Guide tells you
Every car wears at a rate tied to its mileage. Brakes fade, tyres degrade, suspension components loosen - and for most common models, the MOT record shows exactly when these things tend to start showing up as advisories.
The Wear Guide takes the mileage of the specific car you're looking at and maps it against the advisory history of thousands of similar vehicles. For each of nine mechanical categories, it tells you whether cars at this mileage are typically fine, starting to show wear, or regularly flagging issues.
If you're looking at a 90,000-mile car and 3-in-4 similar vehicles have a brake advisory by 85,000 miles, the Wear Guide flags that. You know to look at the brakes at the viewing - not because this car has a problem, but because the data says cars like this usually do by now.
Nine wear categories
Each category covers a distinct part of the vehicle that regularly appears in MOT advisory records. All nine are assessed independently for the car's mileage.
What you see for each category
Each category shows a visual range bar with a dot marking where this car sits, a status label, and the number of MOT records used to calculate the result. Three reference mileages show at what points 1-in-4, 1-in-2, and 3-in-4 of similar vehicles typically flag an advisory.
A minimum of 30 data points is required to show any category. If there is insufficient data for a category, it is hidden rather than estimated.
The data behind it
DVSA records from 2022 to 2024, covering every test across the UK vehicle fleet.
Each mapped independently against mileage thresholds derived from advisory frequency in the dataset.
Required per category before a result is shown. Less than this and no result is displayed.
Source: DVSA, 2022-2024. Data reflects advisory frequency across vehicles sharing the same make, model, and fuel type.
What it looks like in your report
App screengrab
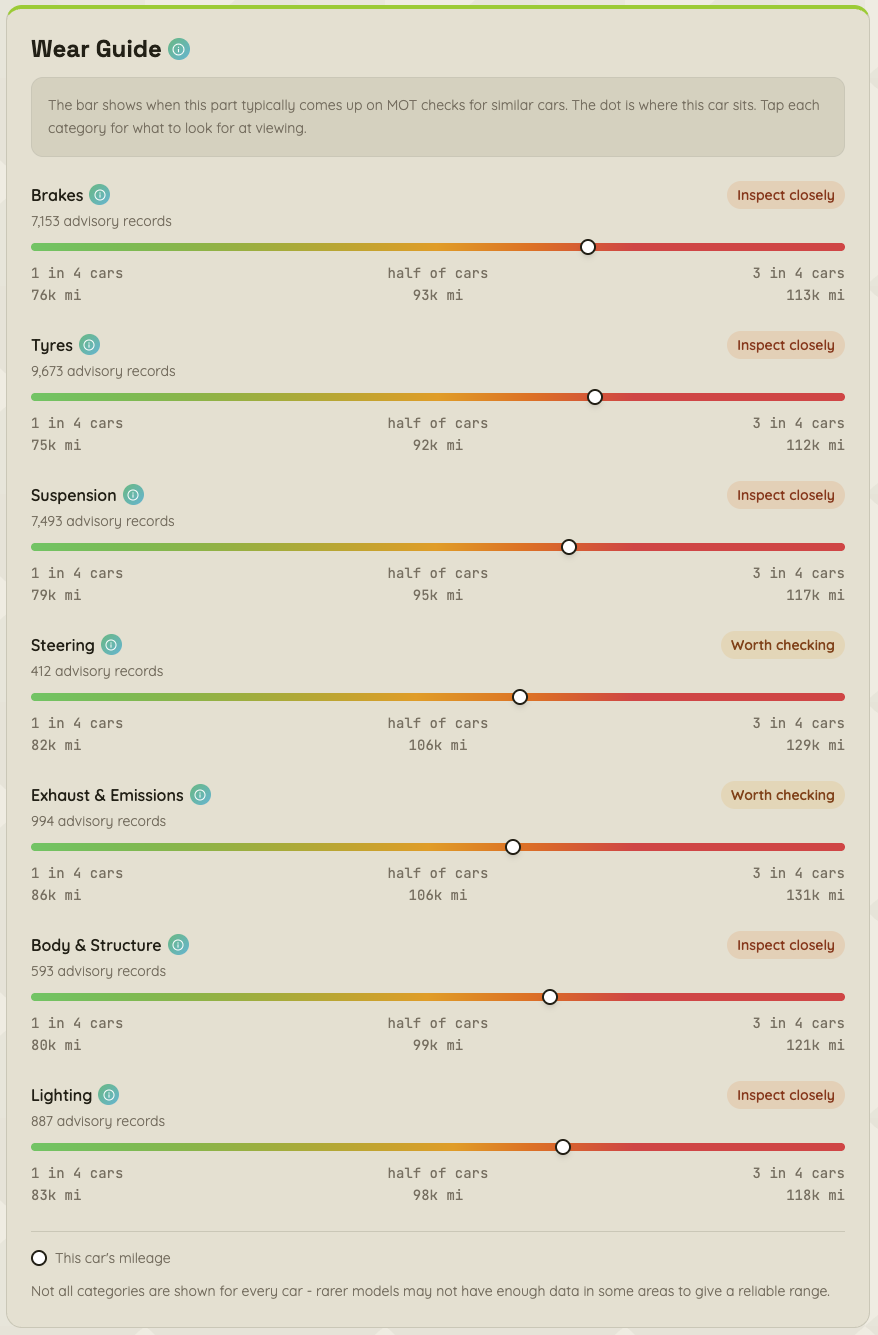
Each category shows a coloured range bar, a dot marking where this car sits, and a clear status label - so you know exactly where to focus at the viewing.
How to use it
Before the viewing
Use the Wear Guide to build a targeted inspection list. If brakes and suspension are flagged at this mileage, arrive knowing what to ask about - what was the last service date, have the brake pads been replaced, when were the tyres last changed. Use the BIB viewing checklist alongside it.
At the viewing
Categories showing "Inspect closely" or "Prioritise at viewing" should inform where a mechanic's inspection focuses. These aren't pass or fail labels - they are statistical prompts based on what tends to go wrong at this stage of a car's life.
In price negotiation
Wear findings that are confirmed at the viewing become legitimate grounds for a price conversation. "3-in-4 cars this age have brake wear - has this been looked at?" is a more grounded question than a guess. It opens a discussion rather than an argument.
Why this is different
Other UK used car tools - HPI, AutoTrader, the DVSA's own checker - show the history of this car. They tell you what has happened. The Wear Guide is predictive: it tells you what is likely to need attention based on where this car sits in its life cycle.
History tells you the car passed its last MOT. The Wear Guide tells you that cars of this type, at this mileage, typically develop suspension advisories within the next 10,000 miles. That's a different kind of intelligence - and it's the one that matters when you're deciding whether to buy.
BIB is the only UK tool that correlates component-level wear data with mileage across the DVSA dataset to produce predictive advisory thresholds at this level of detail.
What it doesn't tell you
Limitations
It reflects population averages
The Wear Guide is based on how cars like this have behaved historically - not what has happened to this specific car. A well-maintained example may be in better condition than the data suggests. An abused one may be in worse shape. Use it as a prompt, not a verdict.
Wear shows up at MOT, not when it happens
The data captures advisories at MOT time, which may be months after the underlying wear developed. The thresholds reflect when issues are officially recorded - actual wear onset could be earlier.
Low-volume models may not have results
If fewer than 30 MOT records exist for a category at a given mileage range, BIB hides the result rather than show something unreliable. Specialist, rare, or recently introduced models may have fewer categories shown as a result.
What this means for you
A green "Fine" rating doesn't guarantee the component is in perfect condition - it means cars like this don't typically flag it at this mileage. A red "Prioritise at viewing" rating doesn't mean the car is broken - it means the data says this is where most similar cars show wear. Treat the Wear Guide as a structured starting point for a more informed viewing, not a substitute for a physical inspection.
See the Wear Guide for any car
One of 13 intelligence sections in every BIB report. £3 per car.
Open BIB