How this car has performed across every MOT it's ever had - and how that compares to other examples of the same make and model on the road.
Every test. Every result.
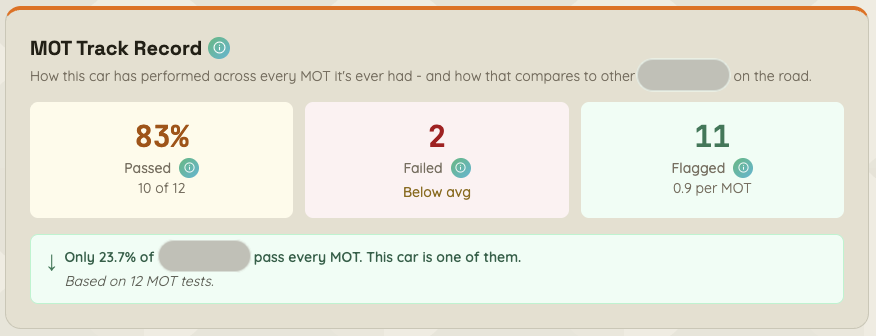
Every MOT test this car has ever been through is recorded and public. BIB pulls the complete picture: how many tests, how many passes, how many failures, and what those failures were.
Looking at the full lifetime at a glance tells you something the most recent test alone can't - whether this car has always been looked after, or only recently.
How many times this car has cleared the minimum standard across its lifetime.
The number of times this specific car was sent away with a fail notice - not the national average, this car.
What percentage of this car's MOT tests have resulted in a failure, calculated across its full recorded history.
When a car has never failed
When a car has passed every single MOT in its history without ever failing, BIB makes that clear - not as a number, but as a statement. A zero failure count buried in a stat box doesn't tell the story. This does.
Never Failed an MOT
This car has passed every MOT test in its recorded history.
How it compares to other examples
Knowing how often this car has failed is only useful if you know how that compares to other examples of the same model. BIB puts the figure in context with a benchmark drawn from the national dataset.
NEVER FAILED - BETTER THAN THE AVERAGE
"34% of Ford Focus models fail their MOT. This one never has."
BELOW THE NATIONAL AVERAGE
"Only 28% of Ford Focus models pass every MOT. This car is one of them."
ABOVE THE NATIONAL AVERAGE
"34% of Ford Focus models fail their MOT - this car fails more often than that."
Example values shown. BIB uses real national failure rates for this make, model, and year from the DVSA dataset.
What it looks like in your report
App screengrab
See how this car stacks up
The MOT Track Record is one of 13 sections in every BIB report. £3 per car.
Check a car with BIB